Intro to Logging Best Practices: 7 Mistakes Devs Still Make in 2026
I'll never forget the 2 a.m. page that started my logging crusade. A production service was silently dropping payments—no errors in the console, just a ghost trail of INFO messages saying "processing payment" with no outcome. After three hours of grepping through terabytes of flat text, I found the culprit: a null pointer exception buried under a mountain of debug noise, all logged at the wrong level. That night taught me that logging isn't just about writing messages—it's about engineering signals out of noise. In 2026, with distributed systems, serverless functions, and AI-driven pipelines, these mistakes are still haunting teams. Here are the seven logging blunders I still see devs make—and how to fix them.
Why Logging Best Practices Still Matter in 2026
You'd think after decades of software engineering, we'd have logging nailed. Yet every week I jump into a Slack thread where someone is trying to debug a production incident and the logs look like a ransom note—random strings, missing timestamps, and no trace of what actually happened. The stakes are higher now. In 2026, your application might span Kubernetes pods, Lambda functions, and third-party APIs, all emitting logs in different formats. Without a solid intro to logging best practices for applications, you're flying blind.
Observability platforms have gotten smarter—tools like Grafana Loki, Datadog, and Honeycomb can ingest petabytes—but they're useless if the logs themselves are garbage. The real problem isn't tooling; it's the human layer. We still make the same mistakes because logging feels like an afterthought, something you sprinkle in when things break. But proactive logging is a first-class engineering discipline. It's the difference between a 10-minute fix and a 10-hour fire drill. Let's walk through the seven mistakes I see most often in 2026, starting with the one that creates the most noise.
Mistake #1: Logging Everything at the Wrong Level
In my own early projects, I'd slap logger.info() on every line—"entering function X," "leaving function Y," "value of counter is 42." The result? A log stream so dense that finding the actual error was like searching for a needle in a haystack of needles. This is the most common mistake in the intro to logging best practices for applications guide: using the same level for everything.
Here's the rule I follow now:
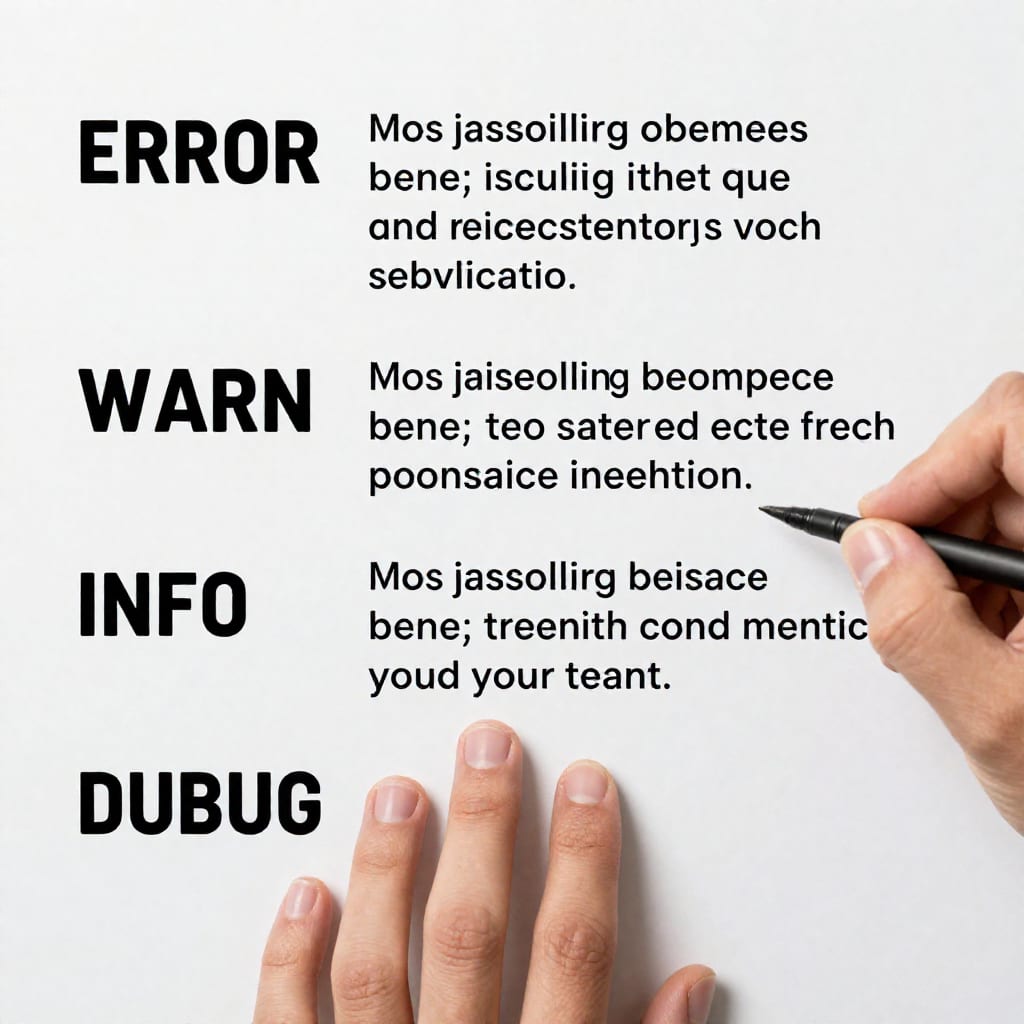
- ERROR: Something is definitely broken—a failed database connection, an unhandled exception, a payment that didn't go through. This triggers an alert.
- WARN: Something unexpected but recoverable—a retry attempt, a deprecated API call, a config fallback. Human should investigate but not drop everything.
- INFO: Normal operational flow—user logged in, order placed, job completed. Useful for auditing and dashboards, not for debugging.
- DEBUG: Detailed troubleshooting data—variable values, step-by-step execution paths. Never turned on in production by default.
I once worked on a team where a junior dev set every log line to INFO because "DEBUG logs don't show in production." That's backwards—you want DEBUG off by default, but when you flip the switch, you get granular detail. The fix is simple: define a level policy in your onboarding docs and enforce it in code reviews. A good linter can flag misuse. In 2026, with AI-assisted code generation, it's even easier to accidentally dump garbage at the wrong level.
Mistake #2: Ignoring Structured Logging (Still Using Plain Text)
I'm shocked at how many codebases I still see using print(f"User {user_id} logged in at {time}") or log.Info("Payment failed for order " + orderID). In 2026, that's like sending a telegram when you have email. Plain text logs are human-readable for five minutes, then they become a nightmare to parse, search, and correlate across services.
Structured logging means outputting JSON objects—or a similar structured format—so that each log entry has a consistent schema. For example:
{"timestamp": "2026-03-15T14:22:01Z", "level": "ERROR", "service": "payment-gateway", "message": "Timeout connecting to Stripe", "requestId": "abc-123", "duration_ms": 5002}Now I can query: "Show me all ERROR logs from payment-gateway in the last hour with duration > 5000ms." With plain text, I'd be writing regexes that break when a message format changes. The structured logging best practices are clear: adopt a library like logrus (Go), winston (Node.js), or structlog (Python) that enforces structure. It takes an afternoon to switch. The payoff? You can feed these logs directly into a centralized tool without custom parsers.
Mistake #3: Not Including Context (Correlation IDs, User Info)
Here's a scenario I lived through last month. A user reports that their order failed. I search the logs for "order failed" and find a generic error message—but no user ID, no session ID, no trace of what request it belonged to. The log is a dead end. Without context, you're guessing.
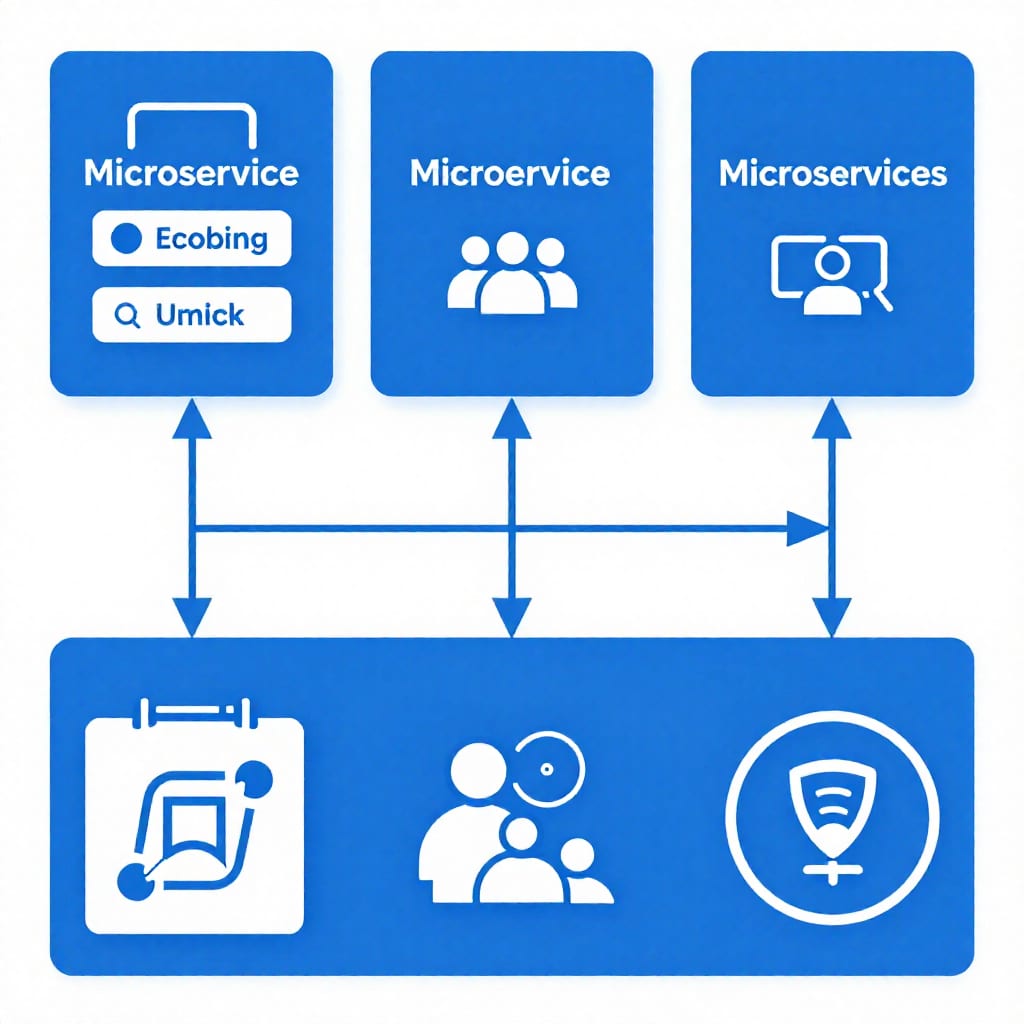
In microservices, this is amplified. Service A calls Service B, which calls Service C. If each service logs independently without a shared correlation ID, you get islands of data. The fix is to propagate a unique request ID—often a UUID—through every layer, usually via HTTP headers or message metadata. Then log it on every entry.
When I set up a new service, I always add a middleware that extracts or generates a correlation ID and attaches it to the logging context. For example, in a Go HTTP handler:
func loggingMiddleware(next http.Handler) http.Handler { return http.HandlerFunc(func(w http.ResponseWriter, r *http.Request) { corrID := r.Header.Get("X-Correlation-ID") if corrID == "" { corrID = uuid.New().String() } ctx := context.WithValue(r.Context(), "correlationID", corrID) w.Header().Set("X-Correlation-ID", corrID) next.ServeHTTP(w, r.WithContext(ctx)) })}Now every log line in that request chain includes the same correlation ID, and you can trace a user's journey from frontend to database. This is the foundation of distributed tracing basics and it's non-negotiable in 2026.
Mistake #4: Over-Logging Sensitive Data (PII, Secrets)
I once audited a log file that contained plaintext passwords, credit card numbers, and API keys—all because someone logged the full request body for debugging. That's a compliance nightmare waiting to happen. GDPR, CCPA, and PCI-DSS all require strict handling of personal data. Logging PII is a fast track to a fine.
In 2026, the stakes are even higher with AI models trained on log data. If your logs contain customer emails or health data, you're feeding that into your analytics pipeline, and suddenly your ML model has learned something it shouldn't.
The solution is log sanitization. Use a library with built-in redaction—like log4j2's custom filters, winston's redact option, or a middleware that strips sensitive fields before logging. For example, in Python with structlog:
import structlogdef sanitize(_, __, event_dict): if 'password' in event_dict: event_dict['password'] = '***' if 'credit_card' in event_dict: event_dict['credit_card'] = event_dict['credit_card'][-4:] return event_dictstructlog.configure(processors=[sanitize, structlog.processors.JSONRenderer()])Never log entire request/response bodies blindly. Whitelist the fields you need. And run a CI step that scans logs for patterns like sk-live- (Stripe keys) or AKIA (AWS keys) to catch accidental leaks. One slip and your secrets are in the log aggregator for anyone with read access.
Mistake #5: Relying Solely on Console Logs in Production
I've seen startups run production on docker logs alone. When the container crashes, those logs vanish. When you need to correlate across 50 instances, you're SSH-ing into each one. That doesn't scale.
Centralized logging is not optional in 2026. Tools like the ELK stack (Elasticsearch, Logstash, Kibana), Grafana Loki, or Datadog aggregate logs from all services into one searchable interface. But the mistake I see is treating centralized logging as a dumping ground—just stream everything and hope for the best. You need to structure your logs (see mistake #2) and set up proper indices so queries don't timeout.
When I set up Loki, I configure log streams per service and add labels like environment, service, and version. Then I can filter instantly: {service="payment-gateway", env="production"} |= "ERROR". Without that, I'm querying everything and paying for compute I don't need. The centralized logging tools are powerful, but they amplify good logs—and bad ones too.
Mistake #6: Setting Log Retention to 'Forever' (or 'Never')
I once inherited a system that had been logging for three years without any deletion policy. The log storage cost was eating 30% of the infrastructure budget, and 90% of those logs had never been accessed. On the flip side, I've seen teams delete logs after 24 hours to save money, then lose critical evidence during an incident postmortem.
The log retention policy best practices are a balancing act:
- Short-term (7-30 days): For day-to-day debugging and incident response. Most issues are found within a week.
- Medium-term (90 days): For compliance and trending analysis. Some regulations require 90-day retention for audit trails.
- Long-term (1 year+): For annual audits, legal holds, or ML training data. Use cold storage (S3 Glacier, Azure Archive) to reduce costs.
Automate this with lifecycle policies. In AWS, you can set S3 rules to transition logs to Glacier after 30 days and delete after 365. In Grafana Loki, configure retention per tenant. And always compress logs—JSON compresses nicely. That 900 GB log set might become 50 GB after gzip. Don't let log storage be an afterthought; it's a line item that grows silently.
Mistake #7: Not Alerting on Log Patterns (Reactive vs. Proactive)
The worst feeling is getting a call from a customer saying "your site is down" and then scrambling to check logs. That's reactive. Proactive monitoring means your logs trigger alerts when something goes wrong—before customers notice.
In 2026, setting up log-based alerting is straightforward with tools like Grafana Loki's ruler or Datadog's monitor. But the mistake is alerting on everything. I've seen teams create alerts for every WARN message, then get desensitized to the noise. The key is to alert on patterns that indicate real impact:
- Error rate spikes (e.g., more than 5% of requests returning 5xx)
- Latency anomalies (e.g., p99 response time > 2 seconds)
- Specific critical exceptions (e.g.,
NullPointerExceptionin the payment service) - Absence of expected logs (e.g., no heartbeat from a service for 5 minutes)
When I set up alerts, I start with the top three error types from the last quarter's incidents. Then I tune thresholds over a week to avoid false positives. The goal is to get a human involved before a small issue becomes a crisis. That's the shift from reactive to proactive.
How to Fix These Mistakes: A Quick Action Plan
If you've read this far, you're probably nodding at a few of these mistakes. Here's a concrete checklist to implement tomorrow:
- Audit your log levels: Run a grep for all log statements and ensure they use the correct level. Add a lint rule to enforce this.
- Switch to structured logging: Pick a library for your language and migrate one service this week. The rest will follow.
- Add correlation IDs: Implement middleware that propagates a request ID through every service. Test by tracing a single user request end-to-end.
- Sanitize sensitive data: Add a redaction layer in your logging pipeline. Scan existing logs for accidental PII and rotate them if found.
- Centralize your logs: If you're still on
docker logs, set up a free tier of Loki or ELK. It takes an hour. - Set retention policies: Configure lifecycle rules today. Start with 30 days and adjust based on actual queries.
- Create three alerts: Pick the top three failure modes from your last incident and write alert rules for them. Test them in staging.
Logging isn't glamorous, but it's the most reliable tool you have when things go wrong. Worth bookmarking before your next deployment—trust me, you'll thank yourself at 2 a.m.